
As a follow on to the post we put up at the start of the pandemic (we’ve been a bit busy hence the lack of posts since!) we thought you might be interested in seeing our access and conversion rates over the past year so you can see for yourself the impact (or rather lack of impact!) the Covid 19 pandemic has had on the effectiveness of Manifest at gaining new business opportunities for its clients.
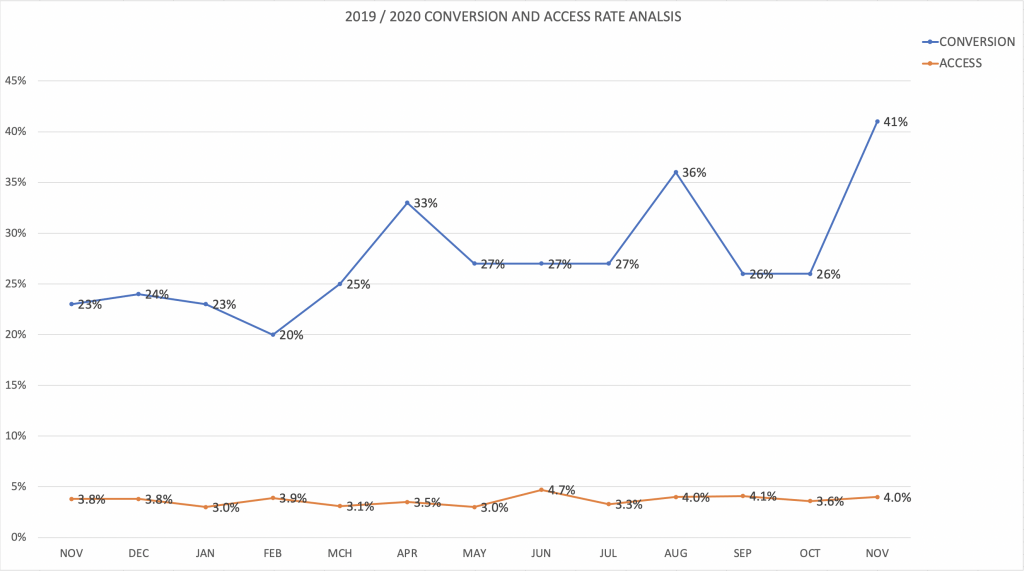
This chart shows the two main key new business prospecting KPIs, what we call “access rate” and “conversion rate”.
Access rate is the percentage of calls that ‘connect’ with the decision maker. We typically expect this to be at about the 3% mark, so for every 100 calls made, we expect to speak to three decision makers (I know, it’s a tough task our new business teams have).
Conversion rate is the percentage of these ‘effective’ calls, that convert into an opportunity, by which we mean one of the following; a face-to-face meeting (either virtual or IRL) or a brief being sent through to us to pass on to our client. We typically expect this to be about 25%.
It is interesting to note that access rates have remained pretty static but that conversion rates dramatically increased when the first lockdown was imposed, then steadied off, peaking in August (which is always natural, some might think oddly but we know this to be the case) before levelling off again in September and October. But then look at November 2020 when the second lockdown was imposed. Or is it because of what happened in the U.S. elections? Whatever has happened, it’s fair to say that there are an awful lot of CMOs and Comms teams meeting with an awful lot of agencies at the moment.
Virtually, of course.
