
Knowing your new business prospecting KPIs will make you a more successful and efficient marketer.
The number of leads generated per week, month or year is an important measure to know when it comes time for presenting prospects with opportunities they might find interesting; but also useful in judging how well one’s own efforts are going!
See a related post HERE on the four cornerstones of sales.
This has never been truer than if your team are working remotely; they may tell you that it is not possible to contact decision makers or that if they do contact them they are not receptive, but this is simply not true and we have the empirical evidence for that right here.
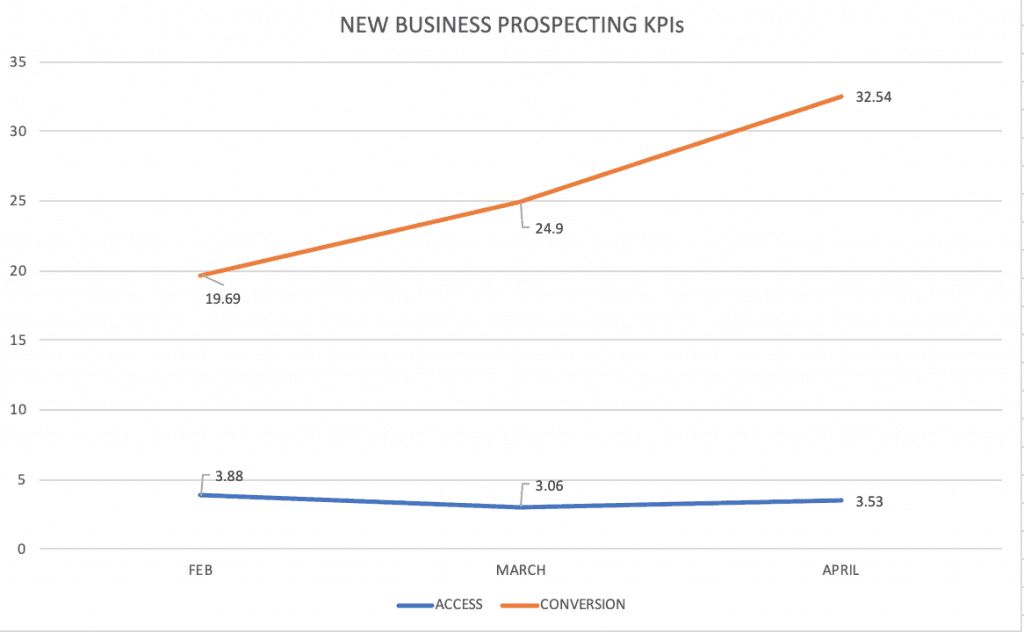
This chart shows the two main key new business prospecting KPIs, what we call “access rate” and “conversion rate”.
Access rate is the percentage of calls that ‘connect’ with the decision maker. We typically expect this to be at about the 3% mark, so for every 100 calls made, we expect to speak to three decision makers (I know, it’s a tough task our new business teams have).
Conversion rate is the percentage of these ‘effective’ calls, that convert into an opportunity, by which we mean one of the following; a face-to-face meeting (either virtual or IRL) or a brief being sent through to us to pass on to our client. We typically expect this to be about 25%.
As can be seen from the chart above showing our new business prospecting KPIs our access rate is steady, but what may be surprising is that our conversion rate in April to date is over 32%. So more than 32% of marketing or communications decision makers we speak with are actively looking at engaging with new agencies.
